
Nodiel@nodiel
XRP, Swing Break and Clear Trend Phase Amidst Downtrend
XRP is continuing its typical downward structure, characterized by lower highs and lower lows. Specifically, the closing of the 4-hour candle broke below both the previous swing low and the 20-period low, clearly confirming the breakdown of short-term support on the chart. The ADX indicator, which measures trend strength, is also hovering above 30, showing that the downward force is relatively clear. As it also shows weakness in relative strength compared to Bitcoin, we need to calmly monitor potential downside volatility until the price recovers the support zone broken on a closing basis.
Market Movements Indicated by Indicators
XRP has confirmed its downward structure by closing below the previous 20-period low and the preceding swing low. The 4-hour ADX is at 31.5, exceeding the 30-level, which indicates a relatively clear downtrend. However, the 1-hour Relative Volume (RVOL) is at 0.75, falling short of the average, suggesting that selling pressure is prevailing in a cautious market rather than active buying. Since relative value against Bitcoin remains weak and no assets in the overall market have moved above the 50-day Exponential Moving Average (EMA50), we must first see a recovery of the lowered support zone.
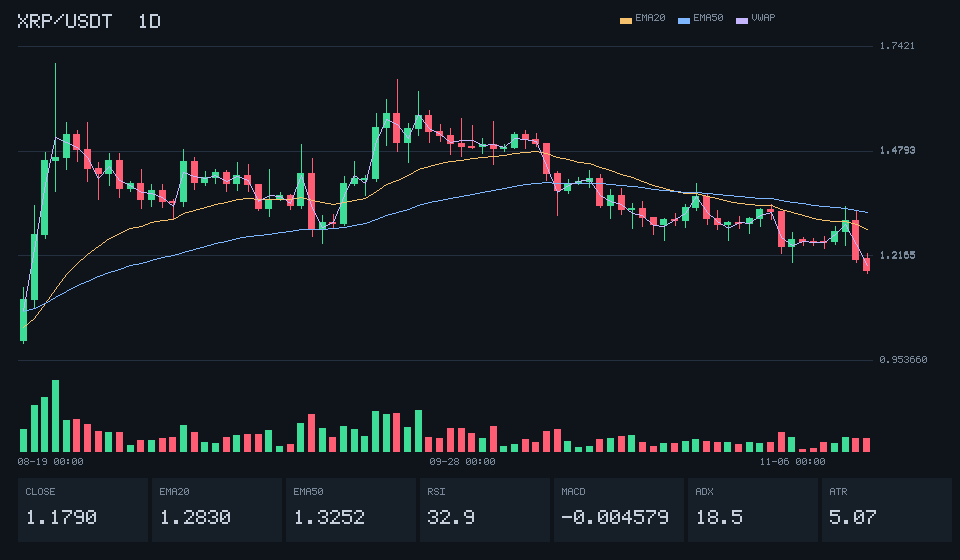
Analysis of the XRP 1D chart shows that the closing price has broken below the previous 20-period low.
Momentum Slowdown and Remaining Challenges
Indicators show a slight deceleration in the steep momentum that was driving the decline, as the negative spread has narrowed. However, it is too early to conclude that the trend has reversed based solely on this signal of speed adjustment. Because the price has closed below both the previous swing low and the 20-period low, the structural downtrend remains clearly confirmed. For the momentum slowdown to lead to an actual reversal, we need to calmly watch for structural changes, such as reclaiming lost zones or forming meaningful new support.
Observing the Market from the Sidelines
As long position liquidations in the derivatives market have increased significantly and the proportion of accounts anticipating a rise has decreased, efforts to support the price have noticeably weakened. The chart also confirms a close below both the established swing low and the 20-period low, indicating a persistent downward flow of lower highs and lower lows. While there are signals that the downward momentum is slightly reduced, this only indicates a slowing of the decline, not a trend reversal. Until the lost support zone is reclaimed or clear conditions for a rebound emerge, it is necessary to calmly observe the market as it finds its footing.