
Nodiel@nodiel
Lower Highs for XRP: Breaking Swing Lows and Observing Market Flow
XRP has closed below the low of the previous 20 candles and its confirmed swing low, continuing the pattern of lower highs and lower lows. By closing below a price level that was expected to act as support, the downtrend has further solidified. On the 4-hour chart, the ADX, which indicates trend strength, is above 31, pointing to clear downward pressure. Additionally, over 80% of liquidations in the derivatives market over the past week have been concentrated on long positions, highlighting a withdrawal of buying interest. While there are signs that the downward momentum is slightly slowing or that the price is temporarily recovering above the daily VWAP, it is still too early to interpret this as a trend reversal unless the closing price returns above the broken swing low.
Confirmed Indicators and Trading Environment
The close below the confirmed swing low has made the bearish structure of lower highs and lower lows even more apparent. The 4-hour ADX stands at 31.5, signaling relatively clear downward pressure, yet the 1-hour Relative Volume (RVOL) is at 0.55, indicating that overall trading activity has quieted down. Rather than a sudden surge of strong selling pressure, the price has drifted lower due to a vacuum in buying interest. Furthermore, the asset and its peers remain below the 50-day Exponential Moving Average (EMA50), and its relative strength against Bitcoin continues to decline, showing a weakened market-wide support level. Although attempts to mitigate short-term losses are observed by reclaiming the daily VWAP, these gains are likely to remain capped until the price can decisively close back above the previous swing low.
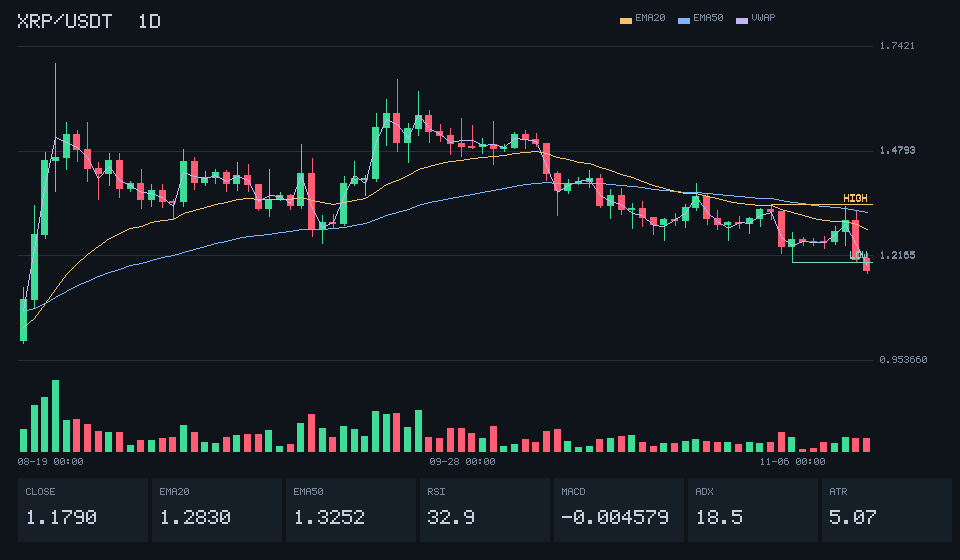
A daily close above 1.3444 could lead to a continuation of a rebound, while a close below 1.2002 may intensify downward pressure.
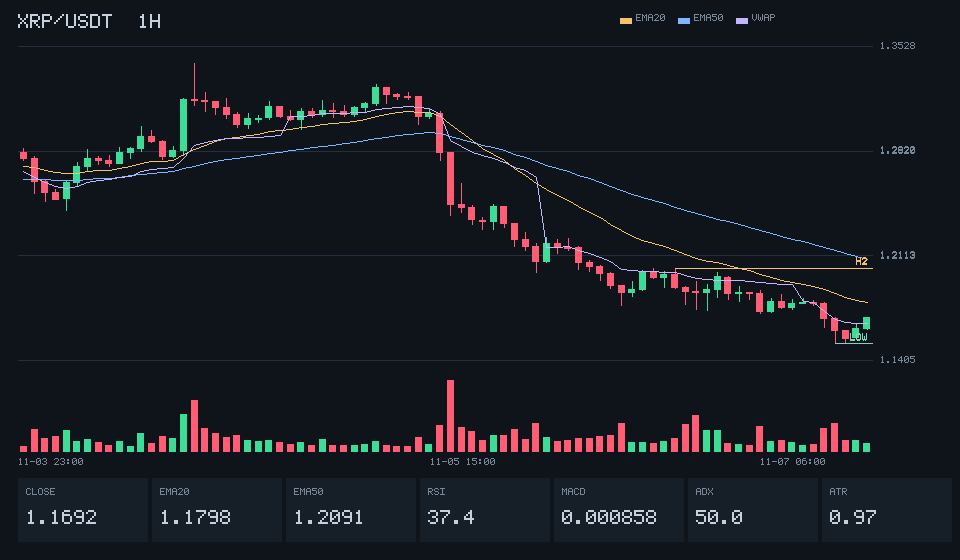
A 1-hour close above 1.2029 could facilitate a short-term rebound, but falling below 1.1519 might break short-term support and prolong the correction.
Momentum Slowdown and Market Perspective
In the short term, the MACD histogram shows a reduction in negative width, and the price has climbed above the daily VWAP, suggesting a slight easing of downward pressure. However, looking at the confirmed candles, the close below the previous 20-candle low and major swing low has solidified a bearish structure of lower highs and lower lows. Even if momentum indicators show signs of slowing, one should remain cautious, as the breakdown of key support structures suggests that this may be nothing more than a temporary technical rebound or a pause in the trend. In fact, in the derivatives market, over 80% of the $36.57 million liquidated over the past week were long positions, and the percentage of long-holding accounts has dropped by 3.06 percentage points, indicating a lack of active buying. Therefore, rather than preemptively predicting a bottom based on short-term deceleration signals, it is necessary to calmly observe whether the price can reclaim the previously broken low with significant volume.
A Phase Requiring Calm Observation
In the derivatives market, over 80% of liquidations over the past week were focused on long positions, and the percentage of long-holding accounts has decreased by over 3 percentage points, reflecting dampened buying sentiment. On the price chart, the daily close below the previous swing low and 20-period low clearly shows the continuation of a bearish structure of lower highs and lower lows. However, signals such as the price returning above the daily VWAP and a narrowing of the MACD histogram suggest that short-term downward pressure is softening. Since a slowdown in momentum does not immediately imply a trend reversal, it is necessary to calmly observe whether the price can reclaim and hold the previous support levels.