
Nodiel@nodiel
CYBER: Momentum Slowdown and Volatility Following Swing High Breakout
CYBER recently closed a bar above its previous swing high, laying the groundwork for a potential short-term trend reversal. Since it had been trapped in a bearish structure of lower highs and lower lows, breaking the previous resistance level with a confirmed close is a meaningful structural step. However, a closer look at the mechanics of this breakout suggests that buying pressure hasn't taken firm control. Volatility has increased significantly, and the price closed back below the daily volume-weighted average price (VWAP), with the bar finishing near the low end of its range. Furthermore, the MACD histogram is narrowing in positive territory, signaling a cooling of short-term momentum. While the resistance breakout is confirmed, short-term indicators are flashing caution, so it is best to patiently observe whether the price can stabilize above the new level.
Confirmed Structure and Indicator Movements
Within the broader downtrend of lower highs and lower lows, the most recent candle close broke above the prior swing high, opening the door for a structural shift. The 4-hour trend strength indicator has exceeded 40, and the volatility indicator (ATR%) has entered the upper range of recent distribution, indicating a notable increase in price swings. However, after the breakout, the price closed back below the daily VWAP, and the 1-hour relative volume (RVOL) has dropped to a quarter of its usual level, signaling a significant cooling in trading participation. Although the price range has widened, the inability to hold the average price level combined with thinning volume suggests that until the price reclaims and stabilizes above this threshold, we are likely to see a period of consolidation rather than a sustained trend expansion.
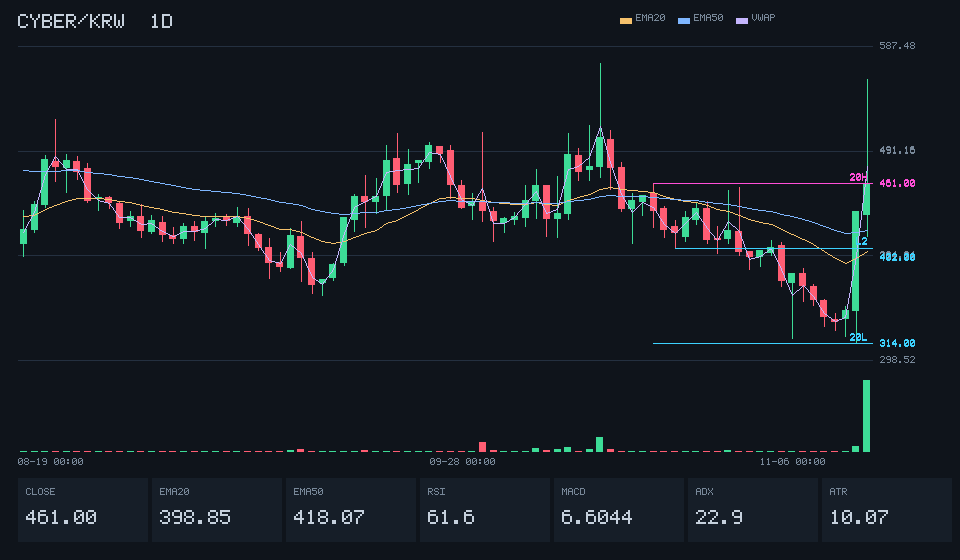
If the daily close moves above 461.00, it could open up a breakout of the upper range, but if it closes below 314.00, the lower support could collapse, leading to further downside adjustment.
Implications of Momentum Slowdown and Increased Volatility
While the confirmed candle attempted to pivot the downtrend by crossing the previous swing high, the internal indicators present conflicting signals. We previously observed a potential decline in bearish momentum via rising RSI lows during the downtrend. Since the breakout, the MACD histogram has been narrowing, suggesting that upside momentum is losing steam. Especially given that price volatility has spiked while the close sits below the daily VWAP and toward the lower end of the candle's range, we need to wait and see if this post-breakout rebound can solidify into a stable trend.
Patiently Observing Trends Amidst Change
Although the price closed above a confirmed swing high, creating an opportunity for a short-term rebound, there are still conditions to weigh before declaring a clear trend reversal. Recent volatility has spiked significantly, the price has drifted back below the daily volume-weighted average, and technical indicators suggest short-term bullish momentum is cooling. With signs of momentum exhaustion coinciding with increased volatility, rather than reading too much into a single breakout, it is time to take a step back and observe which direction subsequent closes firmly break out of the current price range.