
Nodiel@nodiel
CYBER: Price Structure and Indicator Trends Amid Buyback News
CYBER is capturing market attention after announcing the completion of approximately $13 million in token buybacks over the past year. However, the actual price action on the chart continues to show a bearish structure with descending highs and lows. Recently, the price closed below the previous confirmed swing low, confirming a further downward structure. With volatility expanding and the price remaining below the Daily Volume Weighted Average Price (VWAP), short-term selling pressure remains dominant. Conversely, secondary indicators are showing warning signs that bearish momentum is gradually slowing, as indicated by rising RSI lows despite lower price lows. Given the gap between the positive news and the confirmed price structure, it is time to calmly differentiate between indicator warnings and the direction of the trend.
Confirmed Chart Structure and State of Indicators
Currently, CYBER's primary trend is a bearish one with consistently lower highs and lows. On the 4-hour chart, the ADX (Average Directional Index), which measures trend strength, has risen to 41.6, indicating that the pressure in the existing direction remains strong. On the other hand, the 1-hour Relative Volume (RVOL) is stuck at the 0.27 level, showing that short-term trading participation is significantly lower than usual. While a warning of slowing bearish momentum was captured as RSI lows rose while price lows fell, it is difficult to interpret the indicator signal itself as a trend reversal. For a warning of weakening bearish intensity to lead to an actual trend reversal, a new price structure must first be established by closing above key swing highs.
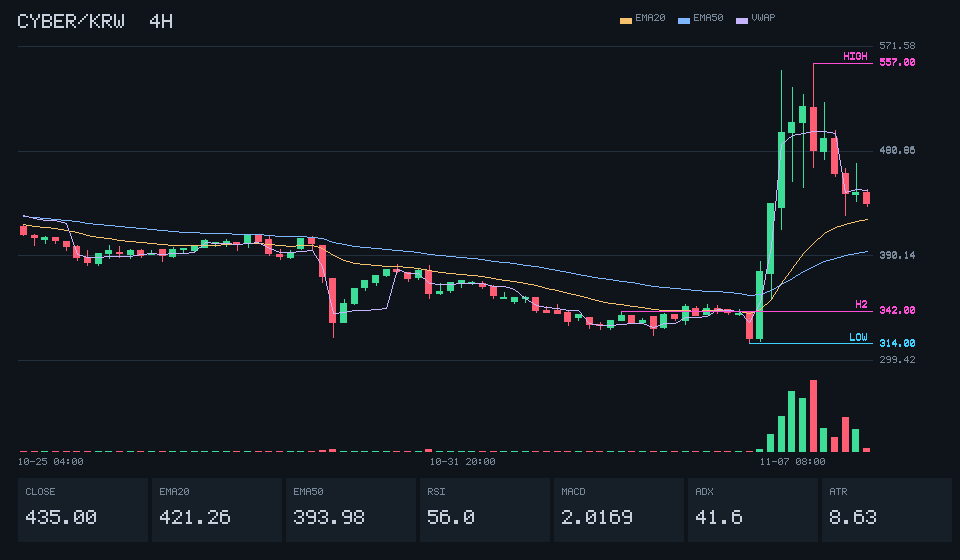
If the price closes above 557.00, we can expect a move to digest the supply zone near the previous high; however, a drop below 314.00 could lead to a continuation of the downward trend.
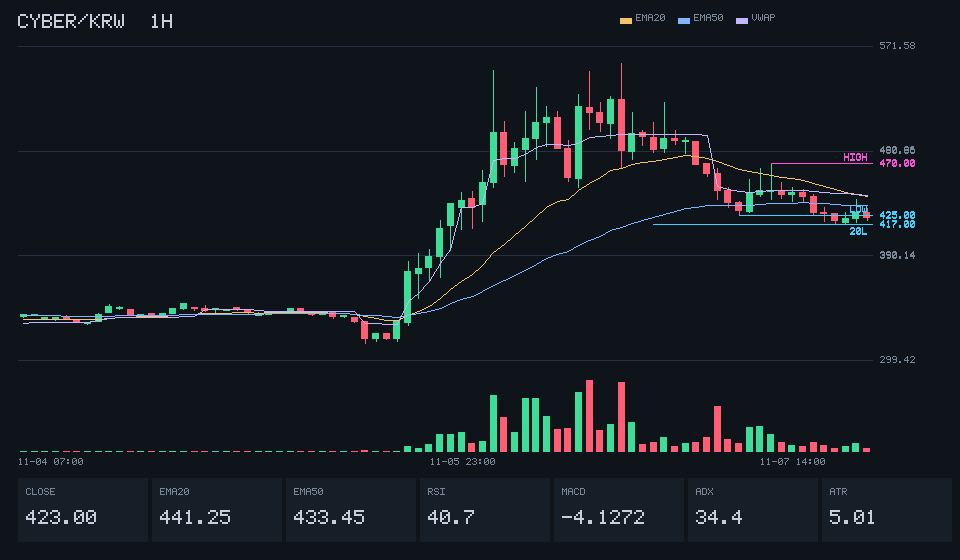
If the candle body establishes itself above 470.00, short-term upward momentum may gain traction, while falling below 417.00 could break the lower bound of the consolidation range and invite additional selling pressure.
Market Phases Indicated by Diverging Signals
Despite the large-scale buyback news, downward pressure emerged as the daily closing price fell below the previous swing low and dropped beneath the Daily Volume Weighted Average Price (VWAP). In secondary indicators, a divergence is visible where RSI lows are rising while price lows decline, and the negative histogram of the MACD is narrowing, signaling a deceleration in bearish momentum. However, these indicator reactions are merely advance warnings of weakening bearishness and do not signify a trend reversal. As daily volatility has expanded again, it is necessary to calmly monitor whether the price recovers key reference lines and closes above significant ranges rather than expecting a premature turnaround.
A Calm Perspective Amid Volatility
Recently, CYBER has seen notable expansion in volatility indicators following buyback-related news. While it initially appeared to gain momentum by surpassing the previous swing high based on the closing price, it has since fallen back below the daily average execution price line, and indicators of upward thrust are also showing signs of deceleration. In periods of high volatility, it is more appropriate to take a measured approach, patiently assessing the directionality by observing whether the price can stably hold onto its short-term established support levels, rather than getting caught up in immediate reactions to news.