
Nodiel@nodiel
UP2: Signals of Momentum Slowdown Amidst an Uptrend
UP2 has confirmed an uptrend structure with higher highs and higher lows, and its relative ratio against Bitcoin (BTC) is also pointing upward. While the price structure maintains an upward flow, the 4-hour ADX is at 40, indicating that the trend strength remains clearly intact. Although the closing price dipped below the daily VWAP before reclaiming it, underlying indicators are showing warnings of slowing momentum. A divergence has formed where price highs are increasing while RSI highs are decreasing, and the MACD histogram, while still positive, is narrowing, suggesting a cooling of upward momentum. However, since this deceleration in indicators serves as a warning of a potential 'speed adjustment' rather than a confirmed trend reversal, it is time to calmly observe whether the established price structure holds.
Observed Price Action and Technical Indicators
While the larger structure continues to print higher highs and higher lows, signs of short-term momentum fading are appearing. The 4-hour ADX is at 40, indicating the existing trend's strength is still robust, but the 1-hour RVOL remains at 0.27, showing that trading activity is significantly quieter than usual. Looking at price action, the close dipped below the daily VWAP before bouncing back above the baseline. However, as the price reached a new high, the RSI peak actually decreased, and the positive MACD histogram is gradually shrinking. Rather than an immediate trend reversal, this divergence and contraction in the histogram should be viewed as a warning that short-term momentum is slowing down, at least until structural changes—like a break of a major swing low—are confirmed.
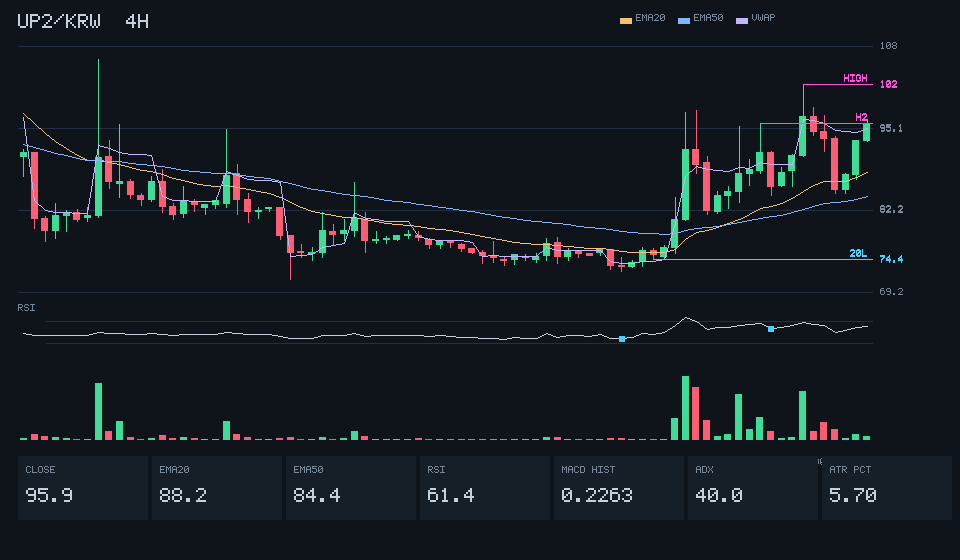
Upbit UP2/KRW spot. Confirmed 4-hour candle close as of 11-08 04:00 UTC (11-08 13:00 KST). In-progress candles are not included. The 4-hour candle closed at 95.9000, reaching the high range. If the next candle fails to close above 102.00, it may pull back toward the 74.4000 area.
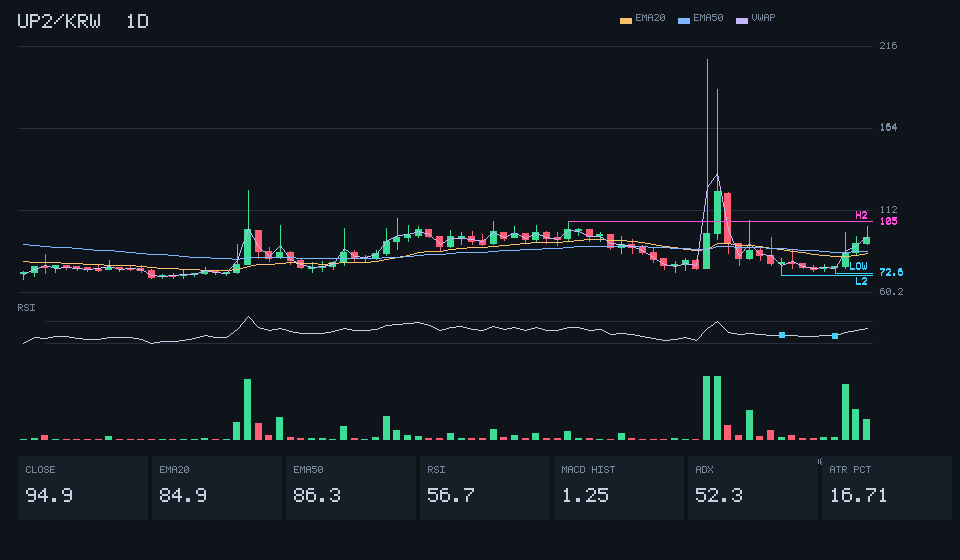
Upbit UP2/KRW spot. Confirmed daily candle close as of 11-08 00:00 UTC (11-08 09:00 KST). In-progress candles are not included. The confirmed close of 94.9 is above the lows of 72.6 and 71.3, and below the high of 105. A close above 105 is required to open up upside potential, while a close below the low of 72.6 would signal a potential breakdown.
The Meaning of Current Trends
The 4-hour ADX at 40 confirms that trend strength remains solid, while the price structure of higher highs and higher lows continues to support the upside. The recovery of the close back above the daily VWAP after a brief dip confirms a return to short-term support. However, we see a divergence where price highs are increasing while RSI highs are falling, and the MACD histogram is narrowing while staying positive—a warning that upward momentum is slowing. Such technical deceleration is best interpreted as a 'speed adjustment' signal rather than a trend reversal, provided there is no structural damage like a break of major swing lows. Notably, with 1-hour Relative Volume (RVOL) at 0.27—indicating significantly reduced participation—we should be open to the possibility of a sideways consolidation period rather than an immediate continuation of a strong rally.
A Period for Calm Observation
Thanks to the price structure of higher highs and higher lows, the overall trend remains bullish, and the 4-hour ADX of 40 confirms clear trend strength. However, we have observed a divergence where RSI highs are falling as price highs rise, and the positive MACD histogram is contracting, signaling that upward momentum is losing steam. Although the closing price regained the daily VWAP after a brief dip, the 1-hour RVOL of 0.27 shows that trading activity is significantly muted. This slowdown in indicators serves more as a cautionary sign than a confirmation of trend reversal; therefore, it is better to wait for the next move rather than make hasty decisions. If a 4-hour candle closes below the most recent swing low, the current bullish outlook will need to be re-evaluated.