
Nodiel@nodiel
Checking Hourly Trading Volume and Market Trends Amid BTC Downtrend
Bitcoin is continuing a downtrend of lower highs and lower lows, closing both the 4-hour and 1-hour candles at $74,089.27 as of 5:00 PM on the 11th. The 4-hour ADX is at 46.4, indicating a strong trend strength directed downward in line with the price structure. The percentage of BTC, ETH, SOL, and XRP assets trading above their 4-hour 50-period moving average remains at 0%, showing that major assets are under pressure below their averages. However, a bullish divergence warning has appeared as the RSI low rises while price lows decline, and the negative MACD histogram is narrowing, suggesting a slight slowdown in downward momentum. Although the 1-hour relative volume (RVOL) increased to 1.27 and the closing price rose above the daily VWAP and the confirmed swing high, the overall downtrend remains unchanged. Whether this rebound continues will need to be monitored in the 1-hour candle close at 6:00 PM on the 11th.
Derivatives and External Market Moves
Looking at the derivatives market, the funding rate for Binance Bitcoin perpetual futures was 0.008% just before 5:00 PM on the 11th, and the projected funding rate for 1:00 AM on the 12th remains at 0.008%. At the same time, the long/short ratio for top traders on Binance Futures was 2.20. On OKX Futures, the funding rate just before 5:00 PM on the 11th was 0.0094% with a projected rate of 0.0092%, and while the account long/short ratio reached 2.69, this is based on accounts and does not directly reflect actual position sizes or liquidation risk. Over the past 24 hours, liquidated positions on OKX Futures totaled $779,000 for longs and $403,000 for shorts. Meanwhile, Bitcoin spot ETF flow data shows that BTC U.S. spot ETFs saw a net inflow of $20.0 million for the 2026-11-10 session; however, as this is a daily figure released after the U.S. market closed, it cannot be considered the cause of the current confirmed candle. Externally, higher-than-expected U.S. inflation data and the possibility of further rate hikes by the Federal Reserve are being cited as factors adding pressure to the broader market.
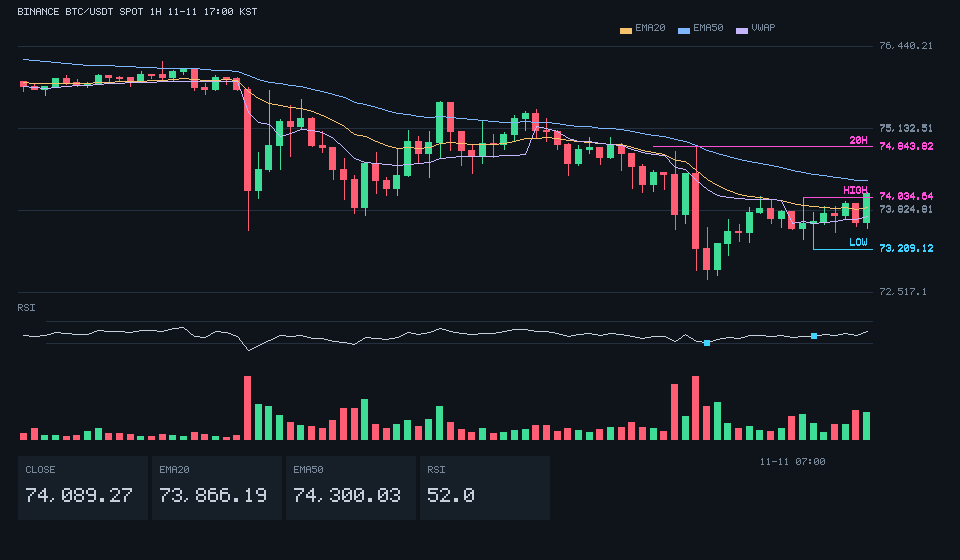
Binance BTC/USDT spot. Confirmed 1-hour candle close 11-11 08:00 UTC (11-11 17:00 KST). Ongoing candles are not included. The confirmed closing price of 74,089.27 is above the high of 74,034.64, above the low of 73,209.12, and below the high of 74,843.82. A close above the high of 74,843.82 would open up further upward movement, while a close below the low of 73,209.12 would signal a potential breakout to the downside.
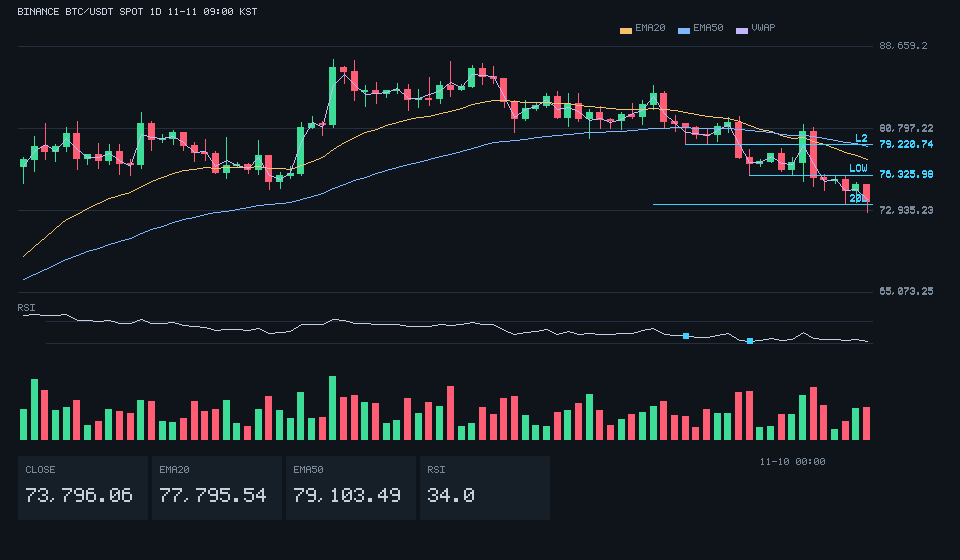
Binance BTC/USDT spot. Confirmed daily candle close 11-11 00:00 UTC (11-11 09:00 KST). Ongoing candles are not included. The confirmed closing price of 73,796.06 is below the lows of 76,325.98 and 79,220.74, and above the low of 73,510. A close below the low of 73,510 would signal a potential breakout to the downside.
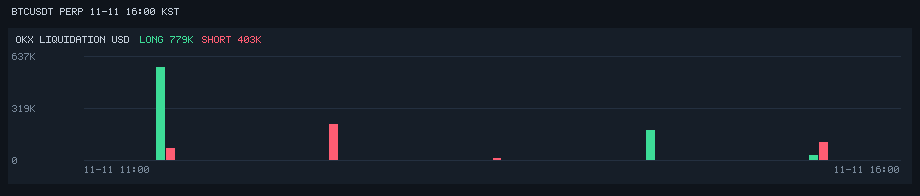
The bars represent the dollar value of liquidations on OKX, divided into long and short liquidations. The last recorded time is 4:00 PM KST on the 11th.
Interpreting Volatility and Momentum Slowdown
While trend strength indicators remain high, the overall price structure is still in a downtrend characterized by lower highs and lower lows. Although increased short-term volume has triggered signals of slowing momentum, it is safer to interpret this divergence as a warning of a temporary deceleration rather than a trend reversal. Furthermore, the Average True Range (ATR) of recent candles has expanded to the upper range of its distribution, making it cautious to prematurely conclude a change in direction based solely on short-term indicator rebounds. To significantly reverse the current bearish structure, a clear breakout of the price range followed by stabilization via confirmed candles must be observed first.
Future Confirmation Criteria
The condition of $74,055.71, based on the previous hour, remains met. The overall price structure is still stuck in a downtrend of lower highs and lower lows, and inflation concerns and fears of further rate hikes in the macro environment point in the same direction as this bearish pressure. Conversely, derivatives market data and U.S. spot ETF fund flows show a somewhat mixed picture that does not entirely align with the downtrend. The interpretation of this downward price structure will change if the 1-hour candle closes at 6:00 PM or 7:00 PM on the 11th, or the 4-hour candle closes at 9:00 PM on the 11th, below $74,055.71.